Basic Plot Settings
Learn how to define settings for various analysis plots.
Transcription:
In this video, I will show you the analysis tab.
I’ve opened this microscope objective, and you can also find it in the example folder.
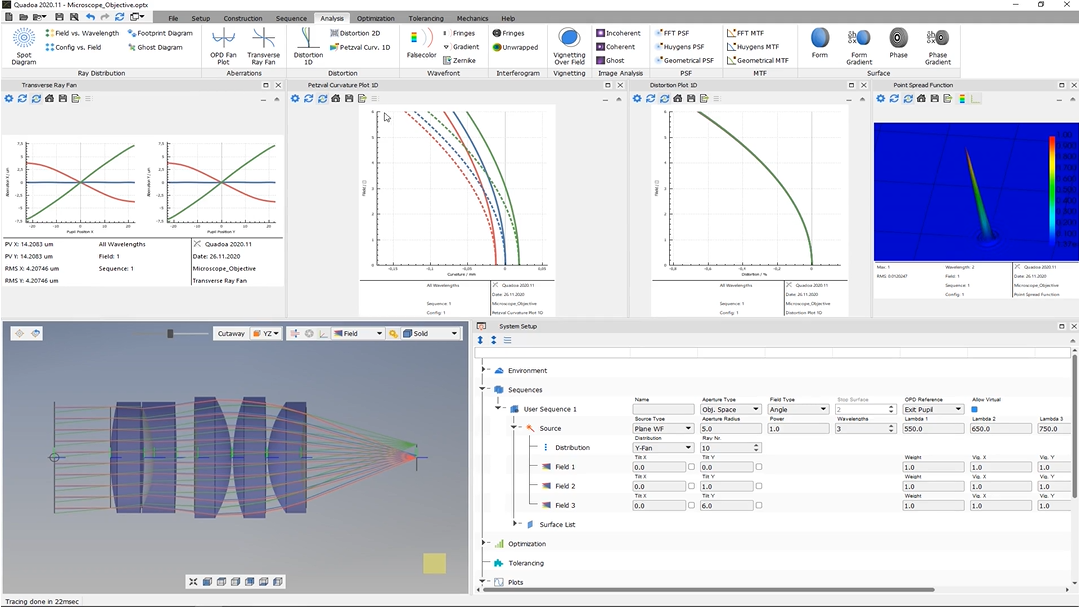
When we take a look here into the analysis tab, we can see here these analysis features and analysis plots, which we also know from optical design.
When we take a look at one of these plots, for example, here this transverse ray fan plot, we see here this icon for the settings. And when we click on the settings icon, we see that we can further define here our plot.
For example, we can select the sequence which we would like to plot or the field or the wavelength.
And the settings, they differ from plot to plot. So in every plot, there are different settings, which we can define.
We can also drag and drop the plots just by clicking with the left mouse button, and then we can move the plots.
We can also undock them, and we can dock them back.
If we take a look here at the system setup, we see that here under the item plots, the plots are also listed here. We can hide the plots by clicking the right mouse button and select hide.
And if you want to show them again, we click again with the right mouse button and click on show.
Yeah. Thank you for watching.