Python Interface
Learn how to use the Python Wizard to create a PSF plot and spot diagram.
Transcription:
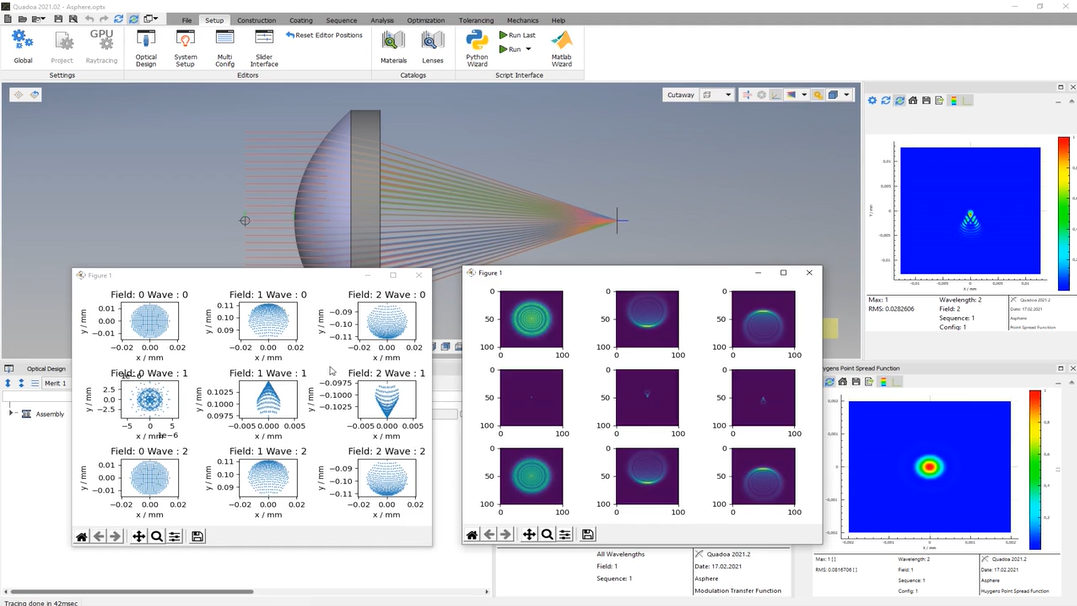
In this video, I will show you how we can use the Python interface to generate a spot diagram and the point spread function.
And for that, I will generate two Python scripts by using here this Python wizard, one script for the spot diagram, and one script here for the point spread function.
If the Python scripts will not run by clicking here on the run button, it may be that you have to specify the path to your installed Python. And for that, you can just go here to the settings, and here under Python, you can select the path to your installed Python.
So first, I will generate a blank script to show you the basics of the script and for that, we will open here the Python wizard And here, out of the drop down menu, we will select here blank script. Just click here on okay and just save it.
And when we take a look at here at the blank script, we can see that first the necessary sinks are imported as here the library for the plots. Here, the core is allocated.
Then the glass, which in our model exists, is imported, and here, of course, the model itself will be imported here.
In the Python wizard, there are even more templates than the blank script. So you can find here templates for the point spread function, for ghosts, or for the spot diagram, and you can easily add more templates just by adding them into the script template folder.
To create the script for the spot diagram, we just select here out of the drop down menu the spot diagram.
Click here on okay to save it, and then here, the spot diagram will be shown.
To generate a script for the point spread function, we open again here the the Python wizard and select here the point spread function script.
Click okay.
Then we save it again.
And now we see here the point spread function plot.
The scripting interface is totally independent here from the graphical user interface, and for that, we can also close here our software, and we can just run here our scripts without the graphical user interface. And for that, we just open here the script, for example, here for the spot diagram, and when we run it here out of Visual Studio, we can see that here the spot diagram has been plotted also here without the user interface.
Yeah. Thanks for watching.